1. Go to Tag Assistant via tagassistant.google.com
2. In the domains field, click Add domain:

3. Enter the full URL address of your website including the https:// protocol, and click Connect.
Leave the Include debug signal in the URL tick, this adds a parameter at the end of the site link, and makes debugging more reliable.

When you click the Connect button it opens up the panel in which you can see all your tags.
4. Navigate to the Google Analytics 4 interface.
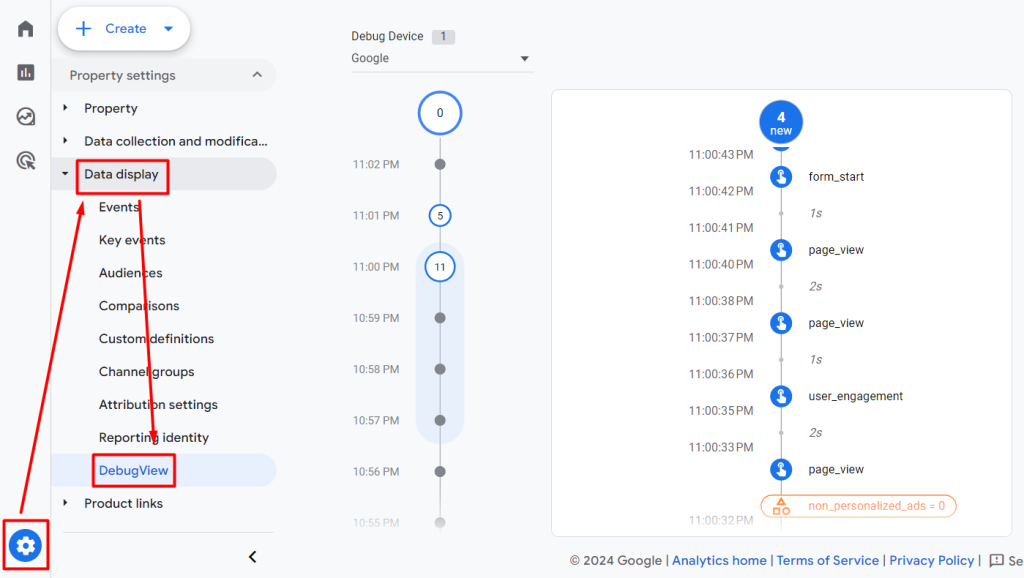
5. Click the Admin tab. At the bottom of the Data display section, click the DebugView tab.
When interacting with the website in this mode, you can see the streams with events, and the exact time when these events took place. See the screenshot:

Note: You will not be able to see any events in DebugView mode if you have applied an internal traffic filter in the active state.

Leave a Reply